
October 20, 2025
October 2025 – Energy News
Due to the government shutdown, the weekly U.S. Energy Information Administration (EIA) has been releasing partial data.
After opening the month at $3.24 per MMBtu, the Henry Hub price declined to $2.83 on October 14. This downward trend is largely driven by record U.S. production, above-average storage levels, and warmer-than-normal temperatures across major consumption regions. While weather continues to influence short-term market conditions, ongoing growth in liquefied natural gas (LNG) exports could increase natural gas demand over the long term.
Domestic Demand
Due to the government shutdown, the EIA’s weekly report does not include demand data. Looking ahead, the NOAA forecast for October 22–28 projects above-normal temperatures across much of the U.S. Warmer-than-average weather typically reduces natural gas demand nationwide, as less energy is required for heating.
International Demand
As the heating season approaches and European storage levels remain below last year’s, reliance on U.S. LNG is expected to grow. By 2026–2027, the U.S. is projected to supply 70% of Europe’s LNG needs, up from 58% this year. Meanwhile, the European Union plans to fully ban Russian LNG by 2027.
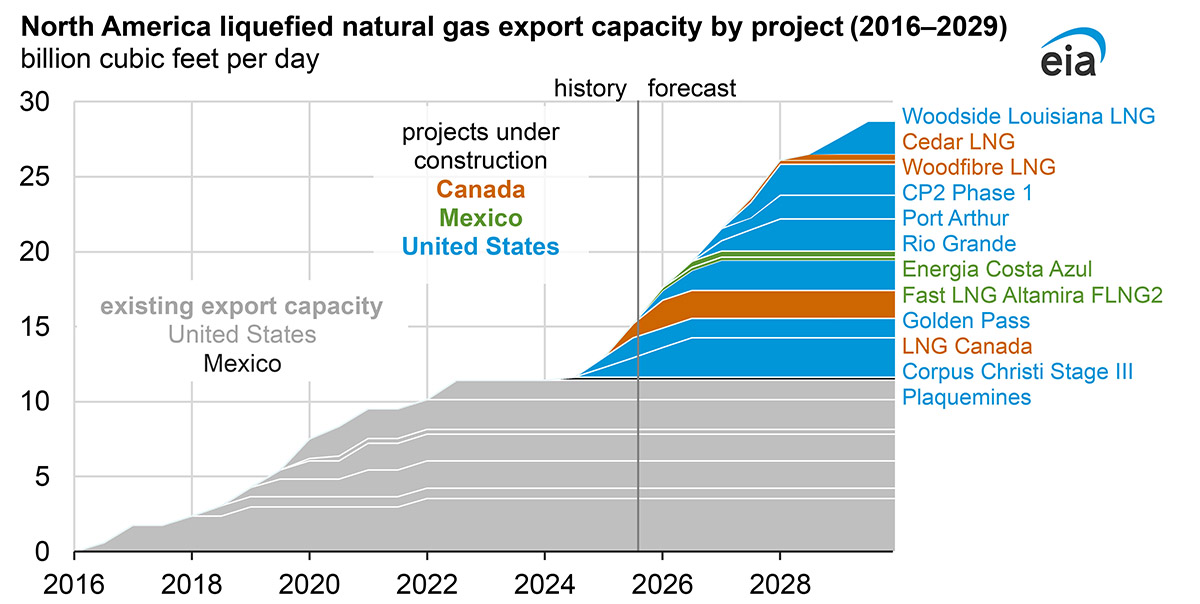
According to a new EIA report, North America’s LNG export capacity could more than double by 2029. At the start of 2024, export capacity stood at 11.4 Bcf per day and is now projected to reach 28.7 Bcf per day within five years. Five additional U.S. facilities have reached final investment decisions and are currently under construction.
This summer, Canada began exporting LNG from its first terminal, LNG Canada, located in British Columbia. This facility is expected to cut shipping times to Asian markets by 50% compared to U.S. Gulf Coast terminals, enhancing North America’s position in the global LNG market.
Production & Supply
U.S. natural gas storage is currently 4.5 percent higher than the five-year average and 0.6 percent higher than last year's levels. In comparison, the number of natural gas rigs has increased significantly by 15.7 percent compared to the previous year.
If you have any questions about the information in this newsletter or would like to talk to someone about your natural gas, please call your sales representative.
Market Data:
October 20, 2025
October 20, 2025
October 2025 – Energy News
Due to the government shutdown, the weekly U.S. Energy Information Administration (EIA) has been releasing partial data.
After opening the month at $3.24 per MMBtu, the Henry Hub price declined to $2.83 on October 14. This downward trend is largely driven by record U.S. production, above-average storage levels, and warmer-than-normal temperatures across major consumption regions. While weather continues to influence short-term market conditions, ongoing growth in liquefied natural gas (LNG) exports could increase natural gas demand over the long term.
Domestic Demand
Due to the government shutdown, the EIA’s weekly report does not include demand data. Looking ahead, the NOAA forecast for October 22–28 projects above-normal temperatures across much of the U.S. Warmer-than-average weather typically reduces natural gas demand nationwide, as less energy is required for heating.
International Demand
As the heating season approaches and European storage levels remain below last year’s, reliance on U.S. LNG is expected to grow. By 2026–2027, the U.S. is projected to supply 70% of Europe’s LNG needs, up from 58% this year. Meanwhile, the European Union plans to fully ban Russian LNG by 2027.
According to a new EIA report, North America’s LNG export capacity could more than double by 2029. At the start of 2024, export capacity stood at 11.4 Bcf per day and is now projected to reach 28.7 Bcf per day within five years. Five additional U.S. facilities have reached final investment decisions and are currently under construction.
This summer, Canada began exporting LNG from its first terminal, LNG Canada, located in British Columbia. This facility is expected to cut shipping times to Asian markets by 50% compared to U.S. Gulf Coast terminals, enhancing North America’s position in the global LNG market.
Production & Supply
U.S. natural gas storage is currently 4.5 percent higher than the five-year average and 0.6 percent higher than last year's levels. In comparison, the number of natural gas rigs has increased significantly by 15.7 percent compared to the previous year.
If you have any questions about the information in this newsletter or would like to talk to someone about your natural gas, please call your sales representative.
Enroll in Choice Gas with Three Easy Steps
Click here to access our online Choice tool, or call our Choice gas experts at 1 (877) 790-4990.
Step 1: Enter your account number
- Your Black Hills Energy account number is located at the top right-hand corner of your bill.
Step 2: Review price offers and make your selection
Step 3: Confirm your selection and enter your control number
- You received a control number in your 2025 Choice Gas customer packet mailed to you from Black Hills Energy. If you cannot locate this, you can retrieve your control number by calling 877-245-3506 or visit choicegas.com
Once enrolled, you will be removed from supplier marketing communications within 24 hours.